
POPULARITY

9 episodes with Envisat

2 episodes with Envisat

4 episodes with Envisat

2 episodes with Envisat

Tout commence avec un livre de vulgarisation scientifique et la passion des phénomènes qu'on ne peut pas tout à fait expliquer. Cette fascination pour la science et l'espace guide depuis toujours Kevin Nocentini, Technology & Innovation Manager chez Capgemini Engineering. Dans cet épisode du Lab, il revient sur son parcours d'ingénieur et sur ce qui l'anime depuis l'enfance : comprendre l'univers et ses systèmes complexes. Il partage son cheminement, de ses premières curiosités scientifiques à son rôle actuel au cœur de la recherche appliquée, où il travaille sur des sujets variés mêlant spatial, ingénierie système et durabilité. L'épisode aborde notamment la question des débris spatiaux, un enjeu largement invisible, mais aux conséquences très concrètes, qui illustre parfaitement son approche de la recherche : explorer, modéliser et progressivement faire émerger des solutions ancrées dans le réel.Un épisode éclairant, pour découvrir le parcours d'un ingénieur passionné par la science et convaincu que la recherche est avant tout une aventure humaine.

On this ID the Future, Stuart Burgess, one of Britain’s top engineers, explains how the skeletal joints in the human body are masterpieces of intelligent design. He also responds to claims by some evolutionists that human joints are badly designed and supposedly evidence of Darwinian evolution's blind trial-and-error process. This presentation was taped at the 2022 Westminster Conference on Science and Faith in the greater Philadelphia area, which was jointly sponsored by Discovery Institute’s Center for Science and Culture, and Westminster Theological Seminary. Here in Part 1, Burgess focuses on the ankle joint, showing that it packs an extraordinary amount of functionality into a small space, beyond anything human engineers have managed to achieve either in prosthetics or robotics. Source

Il primo speciale estivo è una puntata crossover con gli amici di Digitalia, Franco Solerio e Francesco Facconi.. Si parla di satelliti, missioni ESA, software di controllo dei satelliti e tanti aneddoti spaziali e astronautici in vera salsa astronauti-digitaliana. Links ForumAstronautico.itAstronautiNEWS – Le notizie in diretta dallo spazioAstronautiCAST – Il primo podcast di astronautica in lingua italianaAstronautiCAST su TwitterFoto dall'ESACebreros - ESA 30 metres antennaIntegral MissionXMM-Newton operationsGaiaCluster II operationsEnvisat Gingilli del giorno Gaia Sky - open source universe simulator

Vor zehn Jahren brach urplötzlich der Kontakt zum Umweltsatelliten Envisat ab. Der acht Tonnen schwere Satellit von den Ausmaßen eines Reisebusses war Europas Flaggschiff für die Erdbeobachtung.Von Dirk Lorenzenwww.deutschlandfunk.de, SternzeitDirekter Link zur Audiodatei

To bring some joy into a fraught world, we have rounded up a few of the latest image releases of star mergers and galaxies to brighten your day. Plus, we'll look at a few strange exoplanetary systems and their amazing science, talk about the latest GOES satellite to launch, and this week in rocket history is all about Envisat.

Episodio espacial dedicado a la basura espacial, un problema que tiende a agravarse cada día ACTUALIDAD Un tema de especial relevancia Nuevas megaconstelaciones de satélites De 4500 satélites activos en órbita, 1800 son de SpaceX Y pidieron permiso para lanzar 42.000 El operador de satélites más grande en la órbita baja terrestre Starlink ahora mismo implicados en 50% de las alertas de colisión (‘encuentros cercanos'), cuando estén desplegados los primeros 12k, subirá al 90% Las megaconstelaciones cambian un poco el juego. Muchísimos satélites en órbita. Son un riesgo en sí mismos Tienen 1700 avisos a la semana Tienen un sistema autónomo para CAMs Cada maniobra invalida los TLEs de Celestrak. Dificulta el control para otros operadores La NASA expresa su preocupación por el plan de despliegue de satélites de SpaceX por primera vez A la NASA le preocupa el potencial de un aumento significativo en la frecuencia de los eventos de conjunción y los posibles impactos en las misiones científicas y de vuelos espaciales tripulados de la NASA China denuncia ante la ONU que su estación espacial ha tenido que esquivar dos satélites de SpaceX China alega que los satélites Starlink se están volviendo demasiado abundantes e impredecibles en órbita, y quiere asegurarse de que Estados Unidos sepa que es responsable de cualquier daño que causen Pidió al secretario general que recordara a sus socios el Tratado del Espacio Ultraterrestre No está claro si el segundo de Starlink maniobró La delegación china afirma que un satélite Starlink se movía constantemente de manera impredecible ¿Un nuevo escenario de conflicto sinoestadounidense? China ha realizado una prueba que parece ser de retirada de residuos: El satélite Shijian 21, lanzado el 24 de octubre de 2021 desde Xichang en un Larga Marcha CZ-3B/G2 Experimental para validar tecnologías de retirada de basura espacial Se fue a GEO El 01/11 el Pentágono dijo que soltó un subsatélite. ¿Motor de apogeo? Realizaron varias maniobras de acercarse y alejarse Hace poco ExoAnalytic Solutions lo estuvo siguiendo con telescopios desde tierra. Se alejó del subsatélite, se acercó al Beidou-2 G2 (de posicionamiento [China tiene satélites de este sistema en GEO inclinadas]) Se fue acercando, y lo capturó. Luego, se lo llevó casi 3000 km por encima de GEO, a una órbita cementerio (y hacia el oeste de donde estaba). ¿Brazo robot? ¿En la tobera como el MEV-1? ¿Una red? No se sabe. China no dice nada. Este secretismo no les ayuda. Pero, de momento, está clara que su misión declarada es lo que era. Han retirado un satélite no funcional de una zona protegida. Es un logro notable. HISTORIA Un poco de Historia La humanidad ha generado basura espacial desde el principio El satélite más antiguo todavía en órbita es el Vanguard I, lanzado el 17 Marzo 1958, y se espera que dure 240 años (se usó y se usa para estudios de densidad atmosférica) Las últimas etapas de los cohetes se quedaban en órbita. Hay muchísimas todavía Eventos más famosos generadores de basura espacial: El proyecto West Ford (https://en.wikipedia.org/wiki/Project_West_Ford?wprov=sfti1) Esto es "genial". Una prueba de las locuras de la guerra fría En esa época las comunicaciones iban por cables submarinos o rebotando en la ionosfera. ¿Y si los soviéticos cortaban los cables? ¿Era la ionosfera suficientemente confiable? El plan era, atención, lanzar 480 millones de agujas de cobre, muy finas, de 1'78 cm (la mitad de la longitud de onda de la señal de 8GHz) Se lanzaron en tres ocasiones a alturas de más de 3000 km y a 96º y 87º de inclinación (casi polares) En la primera prueba, las antenas no se dispersaban, quedando todas juntas Se abandonó cuando aparecieron mejores soluciones, como los satélites de comunicaciones El embajador USA ante la ONU justificó que perturbaciones como la presión de radiación solar las harían reentrar en pocos años Pero no, algunos de los montones que no se desplegaron siguen arriba 11 de enero de 2007. Prueba antisatélite china (https://en.wikipedia.org/wiki/2007_Chinese_anti-satellite_missile_test?wprov=sfti1). 865 km de altura. Satélite FY-1C, de la serie Fengyun Destruido en un choque frontal con un impactador cinético. El último test anti satélite había sido en 1985 (un misil lanzado desde un F-15 estadounidense) Se detectaron casi 3500 trozos Se calcula que alrededor del 30% seguirán en órbita para el 2035 20 de febrero de 2008. Prueba antisatélite estadounidense (https://en.wikipedia.org/wiki/Operation_Burnt_Frost?wprov=sfti1) Un satélite de la NRO, el USA-193 Se justificó diciendo que llevaba hidracina muy tóxica y que se había perdido el control Se lanzó desde un barco Había un vuelo de la lanzadera espacial programado, así que esperaron a que aterrizara También lo querían muy bajo para minimizar el debris, pero no mucho, al no ser un cuerpo aerodinámico, lo que complicaría las cosas Ventana de ocho días Una altura de unos 250 km Se detectaron 174 piezas, que re-entraron en pocos meses. Dos duraron algo más. La última re-entró 20 meses después Siempre negaron que fuera respuesta a la prueba china. Febrero de 2009: El choque entre un satélite Iridium (operacional) y uno ruso Kosmos 2251 (https://en.wikipedia.org/wiki/2009_satellite_collision?wprov=sfti1). Primer choque entre dos satélites (aunque antes ya habían chocado satélites con debris). Altura de 789 km. Chocaron a 11,700 m/s de forma casi perpendicular Los cálculos realizados por CelesTrak esperaban que estos dos satélites fallaran en 584 metros. 10 días después se estimaron unos 1000 piezas de más de 10 cm (muchas más de tamaño menor). Un año después eran alrededor de 2000. 5 años después, 1500 seguían en órbita (otras habían reentrado) Restos de esta colisión pasaron cerca de la ISS (un trozo pasó a 120 m. La tripulación estaba en las Soyuz) Misión Shakti. 27 marzo de 2019. La India hace su prueba anti satélite (https://en.wikipedia.org/wiki/Mission_Shakti?wprov=sfti1). El objetivo era un satélite de prueba a 283 km Otro impactador cinético Supuestamente, empezaron activamente tras la prueba China Eligieron una órbita baja para minimizar los debris que se generaban Más o menos, en unos meses la mayoría habían reentrado. Los que llegaron más altos tardaron uno o dos años La prueba rusa del 2021. Hablamos de ella en el primer episodio y a ese episodio nos remitimos EL PROBLEMA YA NO ES QUE SE LANCE, SINO QUE NO SE RETIRE Algunas de las altitudes más congestionadas en la órbita terrestre baja son las que van de 750 a 850 kilómetros, un cementerio de satélites rusos, chinos y estadounidenses que han ido abandonándose a lo largo de las décadas. Algunos cuerpos de cohetes que orbitan la Tierra son enormes y pesan alrededor de 9 toneladas, como autobuses Otra altitud problemática es entre 1400 y 1500 kilómetros, donde no hay suficiente resistencia atmosférica para hacerlos frenar. A 500 o 600 kilómetros, el arrastre de la atmósfera derriba los escombros en máx. 10 a 20 años. “A 1400 kilómetros, estará allí durante siglos” El Comando Espacial de EE.UU. actualmente rastrea alrededor de 35000 objetos de escombros, el 70% de los cuales están en órbita terrestre baja. LeoLabs rastrea objetos del tamaño de una pelota de béisbol y más grandes. McKnight dijo que hay entre 500000 y 900000 artículos más pequeños que actualmente no se rastrean y "cruzamos los dedos y esperamos que no nos golpeen". ALERTAS DE COLISIÓN El NORAD empezó a crear bases de datos recopilando lo que hay en el espacio desde el Sputnik ¿En qué consisten estas bases de datos? La información se almacena en lo que se conoce como Two line elements – el sistema clásico de parámetros orbitales Da información de la órbita y su evolución futura Son relativamente precisas para un cierto espacio de tiempo (días / semanas)… …dejan de valer si un satélite maniobra. Celestrak. Probablemente la principal base de datos a día de hoy Hay varias instituciones a día de hoy trabajando en generar alertas de colisiones CSpOC (Combined Space Operations Center en la Vandenberg Space Force Base). Desde 2005, antes se llamaba JSpOC (Joint Space Operations Center), se cambió el nombre en 2018). Hay empresas privadas, como LeoLabs. Muy críticos últimamente con todo el tema de la basura espacial. Después de analizar la probabilidad de colisiones en la órbita terrestre baja y las consecuencias en términos de desechos producidos, la startup de mapeo espacial LeoLabs advierte a los operadores de naves espaciales que se mantengan alejados de ciertas altitudes. "No compre condominios en el rango de 780 a 850 kilómetros", dijo Darren McKnight, miembro técnico senior de LeoLabs, el 6 de enero durante un webcast del Centro de Investigación y Política Espacial de la Universidad de Washington. Esa altitud alberga escombros de un evento ASAT chino, cuerpos de cohetes rusos abandonados y cargas útiles y escombros estadounidenses descartados. PD McKnight también advirtió sobre problemas a 1.400 kilómetros, donde los escombros se acumulan durante siglos. Aparte de decir de forma clara y casi brusca que opina que los USA van muy por detrás del resto en misión de contención de basura espacial. El radar S3TSR (Spanish Space Surveillance and Tracking Space Radar) está situado en la Base Aérea de Morón (Sevilla) y su operación y sostenimiento es responsabilidad del COVE (Centro de Operaciones de Vigilancia Espacial del Ejército del Aire), centro a través del cual España participa en el consorcio EU-SST. El primero de Europa en detectar los restos del satélite ruso Tselina-D tras su destrucción Maniobras para evitar la colisión: Primero se estudia el aviso (suele llegar del CSpOC). Se analiza (determina) mejor la órbita de los dos objetos. Se analiza la probabilidad. Se decide si se maniobra Cambio de órbita Cambio de periodo Consideraciones operacionales (impacto en el combustible y en la misión del satélite) MITIGACIÓN Qué se puede hacer antes, para evitar ser un debris Planificar el final de la vida: Motores, tethers, elementos de añadir resistencia Hay varias estrategias, en función de la órbita Reentrada Órbitas cementerio Para ayudar en Active Debris Removal (ADR): Marcadores, luces, pegatinas, enganches, sistemas de reducción del giro (los satélites muertos giran sin control, en general) Técnicas de retirada activa de basura espacial: Contacto Hay técnicas de tirar (son técnicas que no necesitan una sincronización muy compleja, es decir, el «detumbling» puede hacerse con el propio agarre), y técnicas de empujar (técnicas con una sincronización rígida). Tirar (laxos) Las redes con cable Los arpones con cable Un sistema de agarre con cable Empujar (sincronizados) Brazos robot (con o sin sistemas de amortiguamiento) Tentáculos. Sirven para casos en los que haya cierta incertidumbre en el cuerpo a capturar Sin contacto «Pastoreo» con impulsión iónica (los motores se ponen contra el debris — necesita motores al otro lado para compensar) Tractores electrostáticos Láser (mediante transferencia de impulso, o mediante ablación en el debris) Kits de desorbitación. Por ejemplo, con cohetes de combustible sólido, o con kits desplegables, como con cables, o superficies que incrementen la resistencia. Normalmente antes de capturarlos hay que cancelar su giro. Suelen estar girando sin control. Hay varias técnicas también, muchas relacionadas con los métodos anteriores. NORMATIVA Normativa. Vimos hace poco que Kamala Harris creó un marco de prioridades espaciales para Estados Unidos que incluye eliminación de desechos orbitales, pero no es más que una primera piedra Estados Unidos líder en lanzamientos espaciales, muy retrasada en la retirada de basura ¿Cómo se regula este tema? La normativa es muy escasa. No hay realmente nada a nivel internacional que obligue a tratar con el tema. Algunos países lanzadores pueden tener normativa, de forma que sólo lancen objetos que cumplan ciertas características (porque según los tratados en vigor, el estado lanzador es responsable de los daños que provoquen los objetos que lancen). Aparte de los tratados como el Tratado del Espacio Ultraterrestre, hay recomendaciones, que no obligaciones, como las Guías para la Mitigación de la Basura Espacial, del COPUOS, Comité para el Uso Pacífico del Espacio Ultraterrestre, u otra del mismo nombre del INTER-AGENCY SPACE DEBRIS COORDINATION COMMITTEE La Space systems — Space debris mitigation requirements - ISO 24113:2019, que es voluntaria) Locales. Las ECSS, por ejemplo Dos zonas de especial protección: LEO y GEO. Técnicas: reentradas u órbitas cementerio 25 años máximo en órbita Reentrada controlada si la probabilidad de bajas es mayor a 10e-4 EMPRESAS ¿Qué se está haciendo en este campo? Interés privado: DeorbitKit, RemoveDebris, AstroScale... Detección: LeoLabs, Privateer AstroScale tiene una misión ahora mismo haciendo pruebas, aunque han tenido que detenerlo recientemente por tener un problema Surrey también ha realizado pruebas en órbita Interés público: eDeorbit, Andorid, Clean Space (proyecto ESA, empresa privada suiza), prueba de retirar un adaptador de cohete. GEO: prolongación de la vida (dos misiones ya, las MEV de Northrop-Grumman) El problema es intentar controlar el número de objetos en órbita y, sobre todo, su riesgo. El objetivo hace unos años era retirar cosas grandes (ENVISAT y etapas de lanzadores. Básicamente, que no aumente el problema). Para mantener la situación bajo control se estima que el 90-99% debería desorbitar, lo cual excede las cifras actuales. La Space Force quiere colaborar con empresas privadas. Ha mostrado interés, pero de momento habla poco de financiación. El brazo tecnológico de la Fuerza Espacial conocido como SpaceWERX lanzó un programa llamado Orbital Prime que solicita propuestas de empresas privadas e instituciones académicas sobre tecnologías para eliminar desechos espaciales Los equipos pueden ganar premios en la Fase 1 de $250,000 y premios en la Fase 2 de $1.5 millones. Si se selecciona alguno para una demostración en el espacio, el gobierno financiará una parte del coste. INCLUSO EN LA LUNA Por terminar el tema, comentar que aunque el problema es básicamente terrestre, tenemos que tener cuidado en no «exportarlo» a otros cuerpos. Por ejemplo, recientemente (finales del año 2021), dos sondas lunares tuvieron una alerta. Chandrayaan-2 de la India realizó una maniobra el 18 de octubre para evitar un acercamiento con Lunar Reconnaissance Orbiter de la NASA Chandrayaan-2 realizó una maniobra dos días antes de la conjunción prevista para el 20 de octubre después de que los datos orbitales mostraran que las dos naves espaciales se acercarían a tres kilómetros entre sí. el anuncio pasó desapercibido porque se emitió el mismo día que ocurrió la prueba de misil antisatélite ruso Tanto la NASA como la agencia espacial india ISRO dijeron que se coordinaron entre sí en la maniobra, pero no revelaron cómo decidieron que Chandrayaan-2, en lugar de LRO, debería ser el que maniobre. Chandrayaan-2 entró en órbita lunar en agosto de 2019 y, en ese momento, los funcionarios de ISRO dijeron que la nave espacial tendría suficiente propulsor para operar durante siete años y medio. LRO, por el contrario, ha estado en órbita lunar desde 2009, la NASA dijo el año pasado que tenía suficiente combustible a bordo para al menos seis años más de operaciones. A finales de enero saltó la noticia de que un viejo cohete de SpaceX iba camino de estrellarse contra la Luna. Resulta que los astrónomos estaban equivocados. Sí, un cohete va a impactar de manera descontrolada en la superficie del satélite el 4 de marzo, pero no es la segunda etapa de un Falcon 9, sino el propulsor de un cohete Larga Marcha 3C que se usó en la misión china Chang'e 5-T1 en 2014. ¿PRÓXIMAMENTE MARTE? En marzo, la NASA confirmó que estaba intercambiando datos con la agencia espacial china sobre las órbitas de sus naves que orbitan Marte después de algunas frustraciones iniciales por la falta de datos sobre la órbita de Tianwen-1. PARSEC es un podcast semanal sobre exploración espacial presentado por Javier Atapuerca y Matías S. Zavia. Haznos llegar tus preguntas por Twitter: @parsecpodcast@JaviAtapu@matiass Puedes escucharnos en todas las plataformas a través de parsecpodcast.com.

In this episode, host Andrew Geary speaks with Mohamed Ahmed on geophysical test sites. In this conversation, Mohamed highlights the importance of field exercises, why geophysical test sites can act as a competitive advantage, and the many ways test sites can be used by students and companies (for free). This conversation showcases the importance of experiential learning in novel ways. Visit https://seg.org/podcast for the complete show notes and links to read the articles in March's The Leading Edge. Editor's Note: The construction of the geophysical test site at Texas A&M University-Corpus Christi was supported by the university, as well as the Corpus Christi Geological Society. BIOGRAPHY Dr. Mohamed Ahmed is an Assistant Professor of Geophysics at Texas A&M University-Corpus Christi. His work focuses on applying integrated (geophysics, remote sensing, hydrogeology, modeling, GIS) approaches to investigate a wide range of complex problems. His current research activities involve the use of gravity data (i.e., GRACE, EGM, ground-based), magnetic data (i.e., airborne and ground-based), electromagnetic data (i.e., VLF, GPR), electric data (i.e., VES and profiling), geochemical analyses (i.e., oxygen, hydrogen, and carbon isotopes), remote sensing data (i.e., TRMM, GPM, SMAP, CMAP, Landsat, LiDAR, PALSAR, ERS, Envisat, SPOT, ASTER, GeoEye) and techniques, hydrological (i.e., SWAT), land surface (i.e., GLDAS, CLM), and climate (i.e., CESM) models, statistical approaches (i.e., artificial neural network, linear regression), as well as GIS methodologies and techniques (i.e., web-based GIS) to address a variety of geophysical, geological, hydrological, and environmental problems. SPONSOR This episode is sponsored by TGS. TGS offers a wide range of energy data and insights to meet the industry where it’s at and where it’s headed. TGS provides scientific data and intelligence to companies active in the energy sector. In addition to a global, extensive and diverse energy data library, TGS offers specialized services such as advanced processing and analytics alongside cloud-based data applications and solutions. Visit https://www.tgs.com to learn more. CREDITS Original music by Zach Bridges. This episode was hosted, edited, and produced by Andrew Geary at 51 features, LLC. Thank you to the SEG podcast team: Ted Bakamjian, Jennifer Crockett, Ally McGinnis, and Mick Swiney.

Sen jälkeen kun Neuvostoliitto ja Yhdysvallat 1950-luvun lopulla ampuivat ensimmäiset satelliittinsa maata kiertävälle radalle, sinne on singottu niitä yli 7000. Toimivia satelliitteja on reilu 1000, joten suuri osa maata kiertävistä kappaleista on nykyisin romua. Lisäksi avaruudessa on iso määrä satelliiteista hajonneita metallikappaleita. Yli 10 cm kokoisia roskia on noin 29 000 ja tätä pienempiä yli 166 miljoonaa. Tämä romu aiheuttaa vaaraa uusille satelliiteille ja uhkaa avaruusmatkailua. Yksi romusatelliitti, joka pitäisi saada pois avaruudesta, on ESAn rakentama kaukokartoitussatelliitti Envisat, joka ammuttiin avaruuteen 2002. Se ehti toimia kymmenen vuotta, kunnes se vaurioitui. Nyt tuo linja-auton kokoinen satelliitti kiertää vaienneena romuna maata polaariradalla, joka on yksi tärkeimmistä ja käytetyimmistä satelliittiradoista. Ohjelmassa keskustellaan avaruusromusta laskennallisen avaruusfysiikan professori Minna Palmrothin kanssa. Hän johtaa kestävän avaruustekniikan ja -tieteen huippuyksikköä, joka etsii ratkaisuja romuongelmaan. Yksi mahdollinen menetelmä tehtävänsä toteuttaneiden satelliittien poistamiseen on plasmajarru. Siitä kertoo keksinnön kehittänyt Ilmatieteen laitoksen tutkija Pekka Janhunen. Ohjelman toimittaa Mari Heikkilä. Kuva: Shutterstock

Im Rahmen des ersten Alumitreffens im neu renovierten Mathematikgebäude gibt uns unser Alumnus Markus Even einen Einblick in seine Arbeit als Mathematiker am Fraunhofer IOSB, dem Fraunhofer-Institut für Optronik, Systemtechnik und Bildauswertung in Ettlingen in der Arbeitsgruppe zur Analyse und Visualisierung von SAR-Bilddaten. Er befasst sich mit der Entwicklung von Algorithmen für die Fernerkundung, genauer gesagt für die Deformationsanalyse mit Hilfe von SAR-Interferometrie (InSAR). Deformation bezieht sich hier auf Bewegungen der Erdkruste oder auf ihr befindlicher Strukturen, z.B. von Bauwerken. Hinter dem Stichwort SAR-Interferometrie verbirgt sich eine Vielfalt von Verfahren der Fernerkundung, die auf Synthetic Aperture Radar, auf Deutsch Radar mit synthetischer Apertur, beruhen, und die die Fähigkeit der Sensorik ein kohärentes Signal zu verarbeiten zur Erzeugung sogenannter Interferogramme nutzen. Für SAR ist es wesentlich, dass der Sensor bewegt wird. Zu diesem Zweck ist er auf einen Satelliten, ein Flugzeug oder auch auf einem auf Schienen laufenden Schlitten montiert. Für die Mehrzahl der Anwendungen wird er entlang einer näherungsweise geradlinigen Bahn bewegt und sendet in festen Zeitabständen elektromagnetische Signale im Mikrowellenbereich aus, deren Returns er, unterteilt in sehr kurze Zeitintervalle, aufzeichnet. Dabei "blickt" er schräg nach unten, um nicht systematisch von zwei verschiedenen Orten der Erdoberfläche rückkehrende Signale zu vermischen. Herauszuheben ist, dass er unabhängig von der Tageszeit- er beleuchtet die Szene selbst- und weitgehend unabhängig von den Wetterverhältnissen- die Atmosphäre verzögert das Signal, ist aber für diese Wellenlängen (ca. 3cm-85cm) bis auf seltene Ausnahmen durchlässig dafür- Aufnahmen machen kann. Dies ist ein Vorzug gegenüber Sensoren, die im optischen oder infraroten Teil des Spektrums arbeiten, und nachts oder bei Bewölkung nicht die gewünschten Informationen liefern können. Neben der Magnitude des rückgestreuten Signals zeichnet der SAR-Sensor auch dessen Phasenverschiebung gegenüber einem Referenzoszillator auf, die die Grundlage für die Interferometrie darstellt und viele Anwendungsmöglichkeiten bietet. Aus dem aufgezeichneten Signal wird das sogenannte fokusierte Bild berechnet. (Mathematisch gesehen handelt es sich bei dieser Aufgabe um ein inverses Problem.) Die Achsen dieses komplexwertigen Bildes entsprechen eine der Position des Satelliten auf seiner Bahn und die andere der Laufzeit des Signals. Der Zahlenwert eines Pixels kann vereinfacht als Mittel der aufgezeichneten Rückstreuung aus dem Volumen angesehen werden, dass durch das jeweilige Paar aus Bahninterval und Laufzeitinterval definiert ist. Dies ist der Kern von SAR: Die Radarkeule erfasst eine größere Fläche auf dem Boden, so dass das aufgezeichnete Signal aus der Überlagerung aller zurückkehrenden Wellen besteht. Diese Überlagerung wird durch die Fokusierung rückgängig gemacht. Dazu benutzt man, dass ein Auflösungselement am Boden zu allen Returns beiträgt, solange es von der Radarkeule erfasst wird und dabei eine bekannte Entfernungskurve durchläuft.Die Magnitude des sich so ergebenden Bildes erinnert bei hochaufgelösten Aufnahmen auf den ersten Blick an eine Schwarzweißphotographie. Betrachtet man sie jedoch genauer, so stellt man schnell Unterschiede fest. Erhabene Objekte kippen zum Sensor, da die höhergelegenen Punkte näher zu ihm liegen. Hohe Werte der Magnitude, also hohe Rückstreuung, sind in der Regel mit günstigen geometrischen Konstellationen verbunden: Eine ebene Fläche muss dazu beispielsweise senkrecht zum einfallenden Signal ausgerichtet sein, was selten der Fall ist. Geht man an die Grenze des aktuell Möglichen und betrachtet ein Bild einer städtischen Umgebung eines luftgetragenen Sensors mit wenigen Zentimetern Auflösung, so scheint es beinahe in punktförmige Streuer zu zerfallen. Diese werden durch dihedrale (Pfosten) und- häufiger- trihedrale Strukturen erzeugt. Trihedrale Strukturen reflektieren das einfallende Signal parallel zur Einfallsrichtung (man kennt das von den an Fahrzeugen verwendeten, Katzenaugen genannten Reflektoren). Sehr niedrige Rückstreuung ist meist darin begründet, dass kein Signal mit der entsprechenden Laufzeit zum Sensor zurückkehrt, sei es weil keine Streuer erreicht werden (Schatten) oder das Signal auf glatten Flächen vom Satelliten weggespiegelt wird. Für Wellenlängen von einigen Zentimetern sind z.B. asphaltierte oder gepflasterte Flächen glatt, bei Windstille ist es auch Wasser. Daneben gibt es auch kompliziertere Streumechanismen, die zu Magnituden mittlerer Höhe führen, etwa Volumenstreuung in Vegetation, Schnee und Sand, verteilte Streuung an Flächen mit vielen kleinen, homogen verteilten Objekten (z.B. Kiesflächen oder andere Flächen mit spärlicher Vegetation) oder einer gewissen Rauigkeit. Außer diesen gibt es noch viele weitere Möglichkeiten, wie Mehrfachreflektionen oder das Zusammenfallen in verschiedenen Höhen positionierter Streuer in einer Entfernungszelle.Die für die SAR-Interferometrie wesentliche Information aber ist die Phase. Sie kann allerdings nur genutzt werden, wenn zwei oder mehr Aufnahmen aus annähernd der gleichen Position vorliegen. Die grundlegende Idee dabei ist die Betrachtung von Doppeldifferenzen der Phase zweier Pixel zweier Aufnahmezeitpunkte. Um sie zu verstehen nehmen wir zunächst an, dass sich in beiden Auflösungszellen je ein dominanter, punktförmiger Streuer befindet, was so gemeint ist, dass die Phase einer Laufzeit entspricht. Da die Subpixelpositionen unbekannt sind und die Größe der Auflösungszelle um Vieles größer als die Wellenlänge ist, ist die Phasendifferenz zweier Pixel eines einzelnen Bildes nicht verwertbar. In der Doppeldifferenz heben sich die unbekannten Subpixelpositionen allerdings heraus. Die Doppeldifferenz ist in dieser idealisierten Situation die Summe dreier Anteile: des Laufzeitunterschiedes auf Grund der verschiedenen Aufnahmegeometrien, des Laufzeitunterschiedes auf Grund einer relativen Positionsänderung der Streuer während der zwischen den Aufnahmen verstrichenen Zeit und des Laufzeitunterschiedes auf Grund der räumlichen und zeitlichen Variation der atmosphärischen Verzögerung. Diese drei Anteile können jeder für sich nützliche Information darstellen. Der Erste wird zur Gewinnung von Höhenmodellen genutzt, der Zweite zur Detektion von Deformationen der Erdoberfläche und der Dritte, obwohl meist als Störterm angesehen, kann bei der Bestimmung der Verteilung von Wasserdampf in der Atmosphäre genutzt werden. Es stellt sich aber die Frage, wie man diese Terme separiert, zumal noch die Mehrdeutigkeit aufgelöst werden muss, die darin liegt, dass die Phase nur bis auf ganzzahlige Vielfache von zwei Pi bekannt ist.Weitere Fragen ergeben sich, da in realen Daten diese Annahmen für viele Pixel nicht erfüllt sind. Stellt man sich beispielsweise eine Auflösungszelle mit mehreren oder vielen kleineren Streuern vor (z.B. mit Geröll), so ändert sich die Phase der überlagerten Returns mit dem Einfallswinkel des Signals. Sie ändert sich auch, wenn manche der Streuer bewegt wurden oder die beiden Aufnahmen nicht ausreichend genau zur Deckung gebracht wurden. Dies führt dazu, dass die Phase sich um einen schlecht quantifizierbaren Betrag ändert. Man spricht dann von Dekorrelation. Eventuell besteht nach Änderung der physischen Gegebenheiten in der Auflösungszelle keine Beziehung mehr zwischen den Phasenwerten eines Pixels. Dies ist etwa der Fall, wenn ein dominanter Streuer hinzu kommt oder nicht mehr anwesend ist, ein Gelände überschwemmt wird oder trocken fällt. Es stellt sich also die Frage, welche Pixel überhaupt Information tragen, bzw. wie ihre Qualität ist und wie sie extrahiert werden kann.Die Geschichte der SAR-Interferometrie begann nach dem Start des ESA-Satelliten ERS 1 im Jahr 1991 mit einfachen differentiellen Interferogrammen. Das berühmteste ist sicher das vom Landers-Erdbeben 1992 in Kalifornien. Zum ersten Mal in der Geschichte der Wissenschaft war es möglich, das Deformationsfeld eines Erdbebens flächig zu messen, wenn auch nur die Komponente in Sichtlinie des Sensors. Statt Werte hunderter in der Region installierter Messstationen stellte das Interferogramm ein Bild des Erdbebens mit Millionen Datenpunkten dar. Diese Fähigkeit, großflächig Deformationen der Erdoberfläche aufzuzeichnen, besitzt nur die SAR-Interferometrie! Allerdings ist zu bemerken, dass dieses Resultat seine Entstehung auch günstigen Umständen verdankt. Landers liegt in der Mojave-Wüste, so dass die Variation der atmosphärischen Verzögerung und die Dekorrelation vernachlässigbar waren. Dank der Verfügbarkeit eines guten Höhenmodells konnte der Anteil des Laufzeitunterschiedes auf Grund der verschiedenen Aufnahmegeometrien eliminiert werden (man spricht dann von einem differentiellen Interferogramm). Ein weiterer Meilenstein war die Shuttle Radar Topography Mission des Space Shuttle Endeavour im Februar 2000, während der die Daten für ein Höhenmodell der gesamten Landmasse zwischen 54 Grad südlicher Breite und 60 Grad nördlicher Breite aufgezeichnet wurden. Für diesen Zweck wurde die Endeavour mit zwei SAR-Antennen ausgestattet, eine am Rumpf, eine an einem 60 Meter langen Ausleger. Dank zeitgleicher Aufnahmen waren die Phasenanteile auf Grund Deformation und atmosphärischer Verzögerung vernachlässigbar. Dekorrelation auf Grund von Änderungen der physischen Gegebenheiten spielt hier auch keine Rolle. Dem Wunsch nach einem weltweiten, dazu deutlich höher aufgelösten Höhenmodell kommt seit 2010 die TanDEM-X-Mission des DLR nach, bei der die beiden SAR-Antennen von zwei Satelliten im Formationsflug getragen werden. Auch in der Algorithmik gab es entscheidende Fortschritte. Einer der fruchtbarsten war die Erfindung von Permanent Scatterer Interferometric SAR (PSInSAR) um das Jahr 2000, das durch die Verwendung einer längeren Zeitreihe von differentiellen Interferogrammen und einiger neuer Ideen das Problem der Separierung der im vorangehenden Abschnitt genannten Terme löste. Der Ausgangspunkt hierfür war die Entdeckung, dass häufig eine größere Anzahl über lange Zeiträume phasenstabile Streuer, die sogenannten Permanent Scatterer (auch Persistent Scatterer oder PS), gefunden werden können, die man sich vereinfacht als Pixel vorstellen darf, deren Auflösungszelle einen dominanten, punktförmigen, über die Zeitreihe unveränderten Streuer enthält. Auf diese wird nun die Auswertung beschränkt, die vereinfacht folgende Schritte durchläuft: Definition eines Graphen mit den PS als Knoten und Paaren benachbarter PS als Kanten; Schätzung einer Modellphase für Deformation und Höhenmodellfehler an Hand der Doppeldifferenzen aller verwendeten differentiellen Interferogramme für alle Kanten; Entrollen von Originalphase minus Modellphase, d.h. Auflösen der Mehrdeutigkeiten; räumlich-zeitliche Filterung, um die Variation der atmosphärischen Verzögerung zu eliminieren. Als Produkt ergeben sich für jeden PS seine Bewegung in Sichtlinie des Sensors und eine Korrektur seiner Höhenlage relativ zum für die Erzeugung der differentiellen Interferogramme verwendeten Höhenmodell. Seither wurden diese Grundideen modifiziert und verfeinert. Vor allem müssen die Berücksichtigung verteilter Streuer (auch Distributed Scatterer oder DS) für die Deformationsanalyse erwähnt werden, was die Informationsdichte vor allem in ariden Gebieten drastisch erhöhen kann, sowie die SAR-Tomographie, die eine Analyse auch dann erlaubt, wenn zwei oder drei vergleichbar starke Streuer in einer Auflösungszelle vorhanden sind (z.B. wenn ein Streuer am Boden, eine Fensterniche und eine Dachstruktur den gleichen Abstand zum Sensor haben). Die SAR-Interferometrie, insbesondere die Deformationsanalyse, verwendet vor allem mathematische Methoden aus den Bereichen Stochastik, Signalverarbeitung, Optimierungstheorie und Numerik. Besondere Herausforderungen ergeben sich daraus, dass die Vielfalt natürlicher Phänomene sich nur bedingt durch einfache statistische Modelle beschreiben lässt und aus dem Umstand, dass die Datensätze in der Regel sehr groß sind (ein Stapel von 30 Aufnahmen mit komplexwertigen 600 Megapixeln ist durchaus typisch). Es treten lineare Gleichungssysteme mit mehreren Zehntausend Unbekannten auf, die robust gelöst sein wollen. Für die Auflösung der Mehrdeutigkeiten verwenden die fortgeschrittensten Algorithmen ganzzahlige Optimierung. Wavelet-basierte Filterverfahren werden genutzt, um die atmosphärische Verzögerung vom Nutzsignal zu trennen. Im Zusammenhang mit der Schätzung der Variation der atmosphärischen Verzögerung werden geostatistische Verfahren wie Kriging eingesetzt. Statistische Tests werden bei der Auswahl der DS, sowie zur Detektion schlechter Pixel eingesetzt. Bei der Prozessierung der DS spielen Schätzer der Kovarianzmatrix eine prominente Rolle. Die SAR-Tomographie nutzt Compressive Sensing und viele weitere Verfahren. Zusammenfassend lässt sich sagen, dass die SAR-Interferometrie auch aus Perspektive eines Mathematikers ein reichhaltiges und spannendes Arbeitsgebiet ist. Eine wichtige Anwendung ist die Deformationsanalyse durch die InSAR-Methode: Die SAR-Interferometrie zeichnet sich vor allen anderen Techniken dadurch aus, dass sie bei geeignetem Gelände sehr großflächige Phänomene mit sehr hoher Informationsdichte abbilden kann. Allerdings liefert sie relative Messungen, so dass in der Regel eine Kombination mit Nivellement oder hochgenauen GPS-Messungen verwendet wird. Ihre Genauigkeit hängt neben der Qualität der Daten von der Wellenlänge ab und zeigt bei 3cm Wellenlänge meist nur wenige Millimeter je Jahr Standardabweichung. Damit können selbst sehr feine Bewegungen, wie z.B. die Hebung des Oberrheingrabens (ca. 2mm/y), nachgewiesen werden. Allerdings können wegen der Mehrdeutigkeit der Phase Bewegungen auch zu stark sein, um noch mit PSInSAR auswertbar zu sein. In diesem Fall können längere Wellenlängen, höhere zeitliche Abtastung oder Korrelationsverfahren helfen. Trotz der diskutierten Einschränkungen lässt sich die Deformationsanalyse mit InSAR in vielen Zusammenhängen nutzensreich einsetzen, denn auch die Ursachen für Deformationen der Erdoberfläche sind vielfältig. Neben geologischen und anderen natürlichen Phänomenen werden sie von Bergbau, Förderung von Wasser, Erdgas, Erdöl, durch Geothermiebohrungen, Tunnelbau oder andere Bautätigkeiten ausgelöst. Meist steht bei den Anwendungen die Einschätzung von Risiken im Fokus. Erdbeben, Vulkanismus, aber auch Schäden an kritischer Infrastruktur, wie Deichen, Staudämmen oder Kernkraftwerken können katastrophale Folgen haben. Ein weiteres wichtiges Thema ist die Entdeckung oder Beobachtung von Erdbewegungen, die sich potentiell zu einem Erdrutsch entwickeln könnten. Allein in den Alpen gibt es tausende Bergflanken, wo sich größere Bereiche in langsamer Bewegung befinden und in Leben oder Infrastruktur gefährdende Hangrutsche münden könnten. Auf Grund der zunehmenden Erderwärmung nimmt diese Bedrohung überall dort zu, wo Permafrost zu tauen beginnt, der bisher den Boden stabilisierte. InSAR wird bei der Erstellung von Risikokarten genutzt, die der Beurteilung der Gefährdungslage und der Entscheidung über Gegenmaßnahmen dienen. In vielen Regionen der Erde werden Deformationen der Erdoberfläche durch veränderte Grundwasserstände verursacht. Nimmt das Grundwasser ab, etwa wegen Entnahme zur Bewässerung oder industriellen Verwendung, so senkt sich die Erdoberfläche. Nimmt das Grundwasser während regenreicher Zeiten zu, so hebt sich die Erdoberfläche. Das Monitoring mit InSAR ist hier aus mehreren Gründen interessant. Bewegungen der Erdoberfläche können Schäden an Gebäuden oder anderen Strukturen verursachen (Bsp. Mexico City). Übermäßige Wasserentnahme kann zu irreversibler Verdichtung der wasserführenden Schichten führen, was Konsequenzen für die zukünftige Verfügbarkeit der lebenswichtigen Flüssigkeit hat. Bei Knappheit muss die Entnahme reguliert und überwacht werden (Bsp. Central Valley, Kalifornien). Von besonderer Bedeutung sind durch geologische Phänomene wie Vulkanismus oder tektonische Bewegungen verursachte Deformationen der Erdoberfläche. Die von SAR-Satelliten gewonnenen Daten werden zur Einschätzung von Risiken benutzt, auch wenn eine sichere, frühzeitige und zeitgenaue Vorhersage von Erdbeben oder Vulkanausbrüchen mit den heutigen Methoden nicht möglich ist. Sie sind aber die Grundlage für eine ausgedehnte Forschungsaktivität, die unser Verständnis der Vorgänge in der Erdkruste stetig wachsen lässt und immer genauere Vorhersagen erlaubt. Dies ist in erster Linie den SAR-Satelliten der ESA (ERS-1, ERS-2, Envisat und aktuell Sentinel-1A) zu verdanken, die seit 1991 mit lediglich einer Lücke von zwei Jahren (2012-2014) kontinuierlich die gesamte Erde aufnehmen. Die Idee dabei ist, dass so in festem zeitlichen Rhythmus (bei ERS alle 35 Tage) jeder Punkt der Erde aufgenommen wird. Dadurch ist ein großes Archiv entstanden, das es nach einem geologischen Ereignis ermöglicht, dieses mit den Methoden der SAR-Interferometrie zu untersuchen, da die Vorgeschichte verfügbar ist. Eine Entwicklung der letzten Jahre ist die Nutzung bei der Erschließung von Erdgas und Erdöl. Die mit InSAR sichtbar gemachten Deformationen erlauben es, neue Einsicht in die Struktur der Lagerstätten zu erhalten, geomechanische Modelle zu kalibrieren und letztlich die Rohstoffe Dank optimierter Positionierung von Bohrlöchern effektiver und kostengünstiger zu fördern. Wer InSAR noch besser verstehen will, der findet in den InSAR Guidlines der ESA die Grundlagen sehr gut erklärt. Einen etwas breiteren Überblick über Anwendungsmöglichkeiten kann man sich auf der Homepage von TRE verschaffen, einem Unternehmen, das von den Schöpfern von PSInSAR gegründet wurde und im Bereich InSAR-Auswertungen nach wie vor führend ist. Die Wettbewerber ADS und e-GEOS bieten außer InSAR weitere Anwendungen von SAR-Daten. Aus wissenschaftlich/politischer Perspektive kann man sich in der Broschüre der DLR über Themenfelder der Erdbeobachtung informieren. Zu dem speziellen Thema der Erdbewegung auf Grund Absenkung des Grundwasserspiegels in den USA gibt es weitere Informationen. Literatur und weiterführende Informationen A. Ferretti, A. Monti-Guarnieri, C. Prati, F. Rocca, D. Massonnet: InSAR Principles: Guidelines for SAR Interferometry Processing and Interpretation, TM-19, ESA Publications, 2007. M. Fleischmann, D. Gonzalez (eds): Erdbeobachtung – Unseren Planeten erkunden, vermessen und verstehen, Deutsches Zentrum für Luft- und Raumfahrt e.V., 2013. Land Subsidence, U.S. Geological Survey. M. Even, A. Schunert, K. Schulz, U. Soergel: Atmospheric phase screen-estimation for PSInSAR applied to TerraSAR-X high resolution spotlight-data, Geoscience and Remote Sensing Symposium (IGARSS), IEEE International, 2010. M. Even, A. Schunert, K. Schulz, U. Soergel: Variograms for atmospheric phase screen estimation from TerraSAR-X high resolution spotlight data, SPIE Proceedings Vol. 7829, SAR Image Analysis, Modeling, and Techniques X, 2010. M. Even: Advanced InSAR processing in the footsteps of SqueeSAR Podcast: Raumzeit RZ037: TanDEM-X Podcast: Modellansatz Modell010: Positionsbestimmung Podcast: Modellansatz Modell012: Erdbeben und Optimale Versuchsplanung Podcast: Modellansatz Modell015: Lawinen
The eighty-fourth edition features an Envisat image of the Dasht-e Lut salt desert in southeast Iran.
In the seventy-second edition, we examine an Envisat radar image centred on the man-made Raystown Lake in the US state of Pennsylvania.
In this edition, northern China is pictured in an image from the Envisat satellite.
Die Erdbeobachtung ist heutzutage eine der wichtigsten Aufgaben der Raumfahrt, ist sie doch die Basis der Umweltforschung als auch zunehmend entscheidende Informationsquelle für die Landwirtschaft und viele andere Anwendungen hinaus. Mit GMES steht jetzt ein ganz neues Konzept der Erdbeobachtung an, in das die gesammelte Erfahrung der letzten Jahrzehnte eingeflossen ist und das demnächst mit dem Start des ersten Sentinel-Satelliten seinen offiziellen Beginn einleitet. Neben der schnell zu schließenden Lücke in der Versorgung der wissenschaftlichen Forschung mit umfangreichen Messdaten, die durch das Missionsende des Envisat entstanden ist, öffnet GMES auch vollständig neue Anwendungsbereiche. Mehr als nur die Forschung soll auch die Gesellschaft und Wirtschaft von einer kontinuierlichen Versorgung zahlreicher Datenströme profitieren. Dabei geht GMES auch in der Zugänglichkeit der Daten selbst neue Wege und setzt erstmalig auf ein komplett freien Zugang.
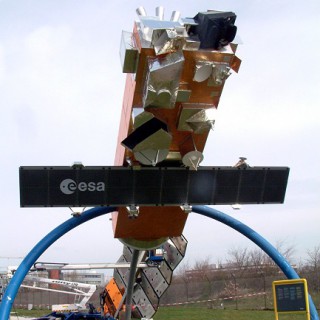
Der Erdbeobachtungssatellit Envisat war nicht nur einer der größten seiner Art, er war auch ein Tausendsassa in seiner Disziplin. In seiner zehnjährigen Betriebsphase - doppelt so lang wie ursprünglich geplant - hat er die Erdbeobachtung maßgeblich geprägt und für vollkommen neue Forschungsfelder und Nutzungen erschlossen. Durch Envisat konnte erstmals ein umfangreiches Bild der Erde geschaffen werden und es wurde die Grundlage für die moderne Umweltforschung gelegt: Ozeanverschmutzung, Tropenwaldabholzung oder die Luftverschmutzung durch die Industrie - die hochentwickelten Instrumente an Bord des Satelliten lieferten vollkommen neue Einblicke in die globalen Auswirkungen unserer modernen Zivilisation. Doch auch für die Vermessung der Erde und die wissenschaftliche Forschung im Allgemeinen war Envisat ein Durchbruch, konnte man mit ihm nun beobachten, wie sich Städte durch den U-Bahn-Bau um Zentimeter absenkten und ganze Länder durch Erdbeben um Meter verschoben. Envisat konnte Vulkanen beim "Atmen" zuschauen und erlaubte die Beobachtung des Ozonlochs. Die hohe Qualität der Daten eröffnete auch schrittweise den Weg von der wissenschaftlichen Forschung hin zu einer wissenschaftlichen Dienstleistung für die Welt.
In this edition, Africa's highest mountains and largest lake are pictured in an image from the Envisat satellite.
In this edition, we examine two images from the Envisat satellite showing northern France and its 'urban heat islands'.
In this edition, we look at an Envisat image of frozen lakes, dotting the Tibetan Plateau in Central Asia.
In this edition, we look at an image from the Envisat satellite of Russia
In this edition, we look at an image of West Africa's coast along the Atlantic Ocean, pictured in the first image from Envisat's MERIS instrument nearly a decade ago.
In this special edition, Envisat Mission Manager, Henri Laur, joins the show to discuss ten years of the Earth-observing mission.
Data on the climate and vegetation cover collected by ESA’s Earth observation satellites are proving to be an invaluable tool to fight food scarcity. With the aid of Earth observation data, the Food and Agriculture Organisation (FAO) of the United Nations state that, in Ethiopia there has been four successive years of increased cereal production. This shows that Earth observation data is leading to better understanding of the conditions that affect crops and grazing pastures, both fragile but vital components in African food production. At the FAO Headquarters in Rome, Italy, satellite data are used to follow vegetation coverage and weather conditions virtually in real-time. That gives scientists a valuable forecasting tool and to some degree, an early-warning system. In addition, at ESA's Centre for Earth Observation just outside Rome, satellite data are being used to map vegetation coverage on an unprecedented scale. This map provides the FAO and the UN with a precise and up-to-date view of global vegetation coverage.ESApod video programme
Relying largely on satellite data, the Global Monitoring for Environment and Security (GMES) programme will provide accurate and timely data to better manage the environment, understand and mitigate the effects of climate change and ensure civil security. ESA is responsible for the Space Component of GMES. It will provide continuous, accurate satellite data from Earth observation satellites, like Envisat and ERS. As part of the GMES programme, ESA is also developing, building and launching a new series of Earth monitoring satellites called Sentinels. The Sentinels are five families of satellites that will monitor the land, oceans, ice and atmosphere for markers of environmental change. Data from the Sentinel satellites as well as other ESA and non-ESA missions contributing to GMES will be combined with measurements taken on Earth. As changes in parameters such as air quality and ocean height are recorded over time, legislation can be put in place to tackle issues such as flooding, deforestation and drought.ESApod video programme
On Tuesday, 24 April, a special session of the 2007 Envisat Symposium was dedicated to the use of EO satellites in support of international environmental conventions in close collaboration with UN agencies, the World Climate Research Programme (WCRP) and the International Geosphere-Biosphere Programme (IGBP).ESApod video programme
The atmosphere took centre stage at a five-day conference held by ESA in Frascati, Italy, with 250 scientists presenting and comparing results from ongoing atmospheric research from ESA's Envisat satellite. ESApod video programme

Fakultät für Biologie - Digitale Hochschulschriften der LMU - Teil 02/06
Unprecedented pressure on the physical, chemical and biological systems of the Earth results in environment problems locally and globally, therefore the detection and understanding of environmental change based on long-term environmental data is very urgent. In developing countries/regions, because the natural resources are depleted for development while environmental awareness is poor, environment is changing faster. The insufficient environmental investment and sometimes infeasible ground access make the environment information acquisition and update inflexible through standard methods. With the main advantages of global observation, repetitive coverage, multispectral sensing and low-cost implementation, satellite remote sensing technology is a promising tool for monitoring environment, especially in the less developed countries. Multi-sensor satellite images may provide increased interpretation capabilities and more reliable results since data with different characteristics are combined and can achieve improved accuracies, better temporal coverage, and better inference about the environment than could be achieved by the use of a single sensor alone. The objective of this thesis is to demonstrate the capability and technique of the multi-sensor satellite data to monitor the environment in developing countries. Land cover assessment of Salonga national park in the democratic republic of Congo of Africa, desertification monitoring in North China and tropical/boreal wildland fire detection in Indonesia/Siberia were selected as three cases in this study for demonstrating the potential of multi-sensor application to environment monitoring. Chapter 2 demonstrates the combination of Landsat satellite images, Global Position System (GPS) signals, aerial videos and digital photos for assessing the land cover of Salonga national park in Congo. The purpose was to rapidly assess the current status of Salonga national park, especially its vegetation, and investigated the possible human impacts by shifting cultivation, logging and mining. Results show that the forests in the Salonga national park are in very good condition. Most of the area is covered by undisturbed, pristine evergreen lowland and swamp forests. No logging or mining activity could be detected. Chapter 3 demonstrates the one full year time series SPOT VEGETATION with coarse resolution of 1 km and the ASTER images with higher resolution of 15 meters as well as Landsat images for land cover mapping optimised for desertification monitoring in North-China. One point six million km2 were identified as risk areas of desertification. Results show within a satellite based multi-scale monitoring system SPOT VEGETATION imagery can be very useful to detect large scale dynamic environmental changes and desertification processes which then can be analysed in more detail by high resolution imagery and field surveys. Chapter 4 demonstrates the detection of tropical forest fire and boreal forest fire. Firstly, the ENVISAT ASAR backscatter dynamics and ENVISAT full resolution MERIS characteristics of fire scars were investigated in Siberian boreal forest, and results show these two sensors are very useful for fire monitoring and impact assessment. Secondly, the general capability and potential of ENVISAT multi-sensor of MERIS, AATSR, ASAR as well as NOAA-AVHRR and MODIS for tropical forest fire event monitoring and impact assessment in tropical Indonesia were investigated, and results show the capability of ENVISAT to acquire data from different sensors simultaneously or within a short period of time greatly enhances the possibilities to monitor fire occurrence and assess fire impact. Finally, the multi-sensor technology was applied to the disastrous boreal forest fire event of 2003 around East and West Lake Baikal in Siberia, and results show that 202,000 km2 burnt in 2003 within the study area of 1,300,000 km2, which is more than the total burnt area between 1996-2002. 71.4% of the burnt areas were forests, and 11.6% were wetlands or bogs. In total 32.2% of the forest cover has been burnt at least once from 1996 to 2003, 14% of the area has been affected at least twice by fire. These demonstrations show that in spite of the two disadvantages of indirect satellite measurements and the difficulty of detecting the cause of environment change, multi-sensor satellite technology is very useful in environment monitoring. However more studies on multi-sensor data fusion methods are needed for integrating the different satellite data from various sources. The lack of personnel skilled in remote sensing is a severe deficiency in developing countries, so the technology transfer from the developed countries is needed.

Fakultät für Geowissenschaften - Digitale Hochschulschriften der LMU
In the last decades microwave remote sensing has proven its capability to provide valuable information about the land surface. New sensor generations as e.g. ENVISAT ASAR are capable to provide frequent imagery with an high information content. To make use of these multiple imaging capabilities, sophisticated parameter inversion and assimilation strategies have to be applied. A profound understanding of the microwave interactions at the land surface is therefore essential. The objective of the presented work is the analysis and quantitative description of the backscattering processes of vegetated areas by means of microwave backscattering models. The effect of changing imaging geometries is investigated and models for the description of bare soil and vegetation backscattering are developed. Spatially distributed model parameterisation is realized by synergistic coupling of the microwave scattering models with a physically based land surface process model. This enables the simulation of realistic SAR images, based on bioand geophysical parameters. The adequate preprocessing of the datasets is crucial for quantitative image analysis. A stringent preprocessing and sophisticated terrain geocoding and correction procedure is therefore suggested. It corrects the geometric and radiometric distortions of the image products and is taken as the basis for further analysis steps. A problem in recently available microwave backscattering models is the inadequate parameterisation of the surface roughness. It is shown, that the use of classical roughness descriptors, as the rms height and autocorrelation length, will lead to ambiguous model parameterisations. A new two parameter bare soil backscattering model is therefore recommended to overcome this drawback. It is derived from theoretical electromagnetic model simulations. The new bare soil surface scattering model allows for the accurate description of the bare soil backscattering coefficients. A new surface roughness parameter is introduced in this context, capable to describe the surface roughness components, affecting the backscattering coefficient. It is shown, that this parameter can be directly related to the intrinsic fractal properties of the surface. Spatially distributed information about the surface roughness is needed to derive land surface parameters from SAR imagery. An algorithm for the derivation of the new surface roughness parameter is therefore suggested. It is shown, that it can be derived directly from multitemporal SAR imagery. Starting from that point, the bare soil backscattering model is used to assess the vegetation influence on the signal. By comparison of the residuals between measured backscattering coefficients and those predicted by the bare soil backscattering model, the vegetation influence on the signal can be quantified. Significant difference between cereals (wheat and triticale) and maize is observed in this context. It is shown, that the vegetation influence on the signal can be directly derived from alternating polarisation data for cereal fields. It is dependant on plant biophysical variables as vegetation biomass and water content. The backscattering behaviour of a maize stand is significantly different from that of other cereals, due to its completely different density and shape of the plants. A dihedral corner reflection between the soil and the stalk is identified as the major source of backscattering from the vegetation. A semiempirical maize backscattering model is suggested to quantify the influences of the canopy over the vegetation period. Thus, the different scattering contributions of the soil and vegetation components are successfully separated. The combination of the bare soil and vegetation backscattering models allows for the accurate prediction of the backscattering coefficient for a wide range of surface conditions and variable incidence angles. To enable the spatially distributed simulation of the SAR backscattering coefficient, an interface to a process oriented land surface model is established, which provides the necessary input variables for the backscattering model. Using this synergistic, coupled modelling approach, a realistic simulation of SAR images becomes possible based on land surface model output variables. It is shown, that this coupled modelling approach leads to promising and accurate estimates of the backscattering coefficients. The remaining residuals between simulated and measured backscatter values are analysed to identify the sources of uncertainty in the model. A detailed field based analysis of the simulation results revealed that imprecise soil moisture predictions by the land surface model are a major source of uncertainty, which can be related to imprecise soil texture distribution and soil hydrological properties. The sensitivity of the backscattering coefficient to the soil moisture content of the upper soil layer can be used to generate soil moisture maps from SAR imagery. An algorithm for the inversion of soil moisture from the upper soil layer is suggested and validated. It makes use of initial soil moisture values, provided by the land surface process model. Soil moisture values are inverted by means of the coupled land surface backscattering model. The retrieved soil moisture results have an RMSE of 3.5 Vol %, which is comparable to the measurement accuracy of the reference field data. The developed models allow for the accurate prediction of the SAR backscattering coefficient. The various soil and vegetation scattering contributions can be separated. The direct interface to a physically based land surface process model allows for the spatially distributed modelling of the backscattering coefficient and the direct assimilation of remote sensing data into a land surface process model. The developed models allow for the derivation of static and dynamic landsurface parameters, as e.g. surface roughness, soil texture, soil moisture and biomass from remote sensing data and their assimilation in process models. They are therefore reliable tools, which can be used for sophisticated practice oriented problem solutions in manifold manner in the earth and environmental sciences.
Fakultät für Physik - Digitale Hochschulschriften der LMU - Teil 01/05
“Optimisation of the choice of parameters for an operational off-line retrieval of vertical profiles of trace gases from MIPAS data”. Since March 2002 the environment satellite ENVISAT is operational. ENVISAT carries a series of instruments used for remote sensing the earth atmosphere. MIPAS, as one of those instruments is, due to its conception as a limb sounding infrared spectrometer, intended to provide new insights in the chemical processes of the middle atmosphere. To achieve this MIPAS measures emissions of trace gases like H2O, O3, CH4, NO2, N2O, HNO3. Additionally MIPAS acquires global pressure and temperature profiles. Vertical profiles of trace gases are computed from calibrated measurements in the processing chain by an iterative calculating scheme (retrieval). To this measurements are compared with simulated spectra from a forward model. At each comparison modelling parameters are systematically adjusted until an agreement in the compared quantities is reached, which lies within the boundaries of some previously defined criteria. Improvements in the retrieval scheme are possible in three categories: first, adjustments in the side constraints (regularisation), which divide the mathematical possible solutions from the physical reasonable, are conceivable. Second, adjustments in the handling of certain systematic errors are necessary and finally, one is interested in eliminating measurements which have become useless due to cloud influences. To obtain a measure for the improvements, some criteria are defined and discussed in this work, with which it is possible to compare differently parameterised retrievals with regard to their quality. These criteria are: height resolution (averaging kernel), information content and degrees of freedom, as well as common quantities like root mean square. The subject regularisation is being discussed by the means of a comparison between a newly developed approach (HoMa), a not yet with operational trace gas retrievals used maximum entropy method (MEM2) and the standard methods Optimal Estimation and Tikhonov. It can be shown, that the alternative methods have massive advantages compared with the standard methods in terms of the above defined criteria. This also is true for aspects like transparency, diagnostic options and quality of the retrieved profiles. Especially the results of MEM2 have to be pointed out, because it does not use a priori knowledge. The treatment of systematic errors shows, that this is an essential part of every retrieval. The results of computations with simulated data while using the corrections show tremendous improvements compared to results of not corrected computations. The part which deals with the consideration of cloud influences in measurements shows the advancement of an established idea. A detailed analysis of cloud indices enables to rescue measurements which otherwise would have been parcelled out for security reasons. This may lead to gather additionally knowledge about tropospheric regions from MIPAS measurements. A comparison of results of the work with independent results from the ROSE-model delivers promising consistence.
Fakultät für Physik - Digitale Hochschulschriften der LMU - Teil 01/05
The fully automated in-situ measuring system SIOUX (StratospherIc Observation Unit for nitrogen oXides) has been developed and established under flight conditions. SIOUX is a two channel measuring device designed for the high-altitude research aircraft M55-Geophysica to record reactive nitrogen oxides in the upper troposphere and the lower stratosphere. Channel A detects nitric oxide (NO) and channel B the total reactive nitrogen (NOy), which is reduced to NO on the surface of a heated gold-converter in conjunction with carbon monoxide (CO) as reducing agent. The technique used for the measurement of NO is chemiluminescence. The detection limit of channel A is 6 pmol/mol and of channel B 10 pmol/mol for an integration time of 1 s. The main components of SIOUX are the sample inlet, the detector incorporating the reaction chambers, photomultipliers and ozone generators, the converter, a pumping system, a calibration/operation gas system and the data recording unit. Except for the sample inlet all components are housed in a pressurised aluminium container. This has a length of 1.1 m, a diameter of 0.6 m and a total mass of 250 kg; the maximum power consumption of SIOUX is 1300 W. For aeronautical compliance four test procedures were required to guarantee the flight compatibility of the mechanics and electronics of the device: shock/vibration/EMC (ElectroMagnetic Compatibility)/pressure test. In October 2001 SIOUX was implemented for the first time aboard the M55-Geophysica during a test campaign in Russia. There, the measuring system was monitored under flight conditions and its operation was established for stratospheric conditions. Mixing ratios for NO and NOy were registered up to an altitude of 20 km. In July 2002 SIOUX was used aboard the M55-Geophysica for validation the ENVISAT instrument MIPAS-E in Italy. A comparison was made for the first time between MIPAS-E measurements of nitric acid (HNO3) and SIOUX measurements of NOy-NOx (≈ HNO3 in the altitude range 17 - 20 km). A mean deviation of 20% ± 6% between the MIPAS-E and the SIOUX data was registered.
© 2020-2026 Ivy Podcast Discovery LLC
